May 23, 2023| BUSINESS,OPERATIONS KPI dashboards are tools that unite disparate data sources and provide at-a-glance visual feedback showing how your business is performing against your key performance indicators (KPIs).
Traditionally, only top management looks at dashboards and they look at them retroactively. With smart on-line dashboards, available om mobile, every employee can see relevant data, often in real time. This means decisions can be taken proactively and outcomes improved by people closest to operations – and thus, your customers.
For a franchise network, these numbers can show overall network generic data in combination with unique local performance, supporting franchisees with a foundation for sound business decisions. A good KPI dashboard provide users with: A fast, easy solution to tracking KPIs and other business metrics. A unified view of data that improves visibility into company health, both at central and local level. Customizable data visualization with performance and status indicators, so it’s super easy to understand for those in local operations.
As you modify your KPI definitions, data sources, or targets, these updates will populate automatically into your dashboards—saving you valuable time and effort.
How can you distribute a KPI dashboard across your franchise network and ensure that each franchisee’s data remains confidential?
Chainformation, an intelligent and efficient cloud application for franchise management, offers a robust role-based permission structure. Each user identity is associated with a specific unit/location and job description/role. By integrating your KPI dashboard with Chainformation, you automatically gain granular access control, allowing you to make local data available to each location. Chainformation serves as the ideal platform for distribution and access across any multi-location business.
However, what about the KPI reports themselves? How can they be created and utilized effectively?
In this article, we highlight a method employed by one of Chainformation’s implementation partners: Embedsy (https://embedsy.io/). Embedsy specializes in the Microsoft Power BI platform, which enables the creation of Embedded Analytics (EA).
Embedded Analytics allows for the development of user-friendly and powerful reports that can be accessed on the platforms franchisees and employees already use, eliminating the need to learn a new platform for data insights. By utilizing the same platform people interact with daily, such as Chainformation, the data becomes more accessible and contextualized, resulting in greater relevance.
Collect data from multiple sources -create one unified view
The EA dashboard can collect live data from numerous sources and merge it all into one comprehensive dashboard. Below are some examples from a “demo”- Restaurant Brand in the Chainformation platform, where data is available from multiple sources:
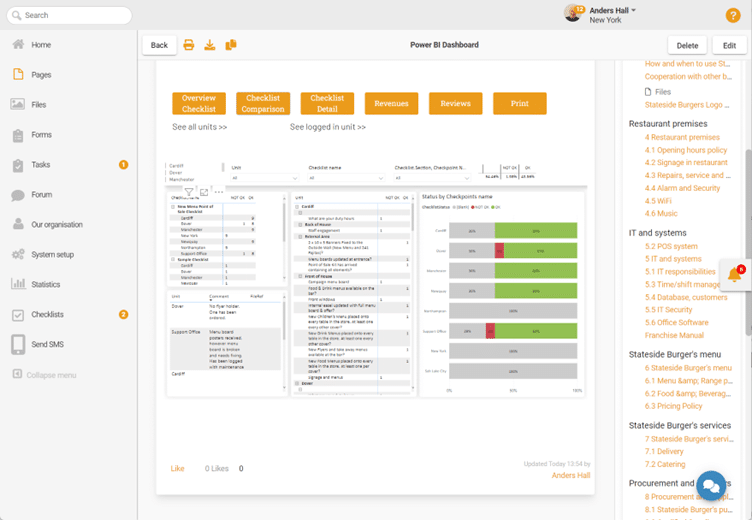
- The integrated Digital Checklists used to measure operational compliance and status on SOPs in Chainformation
- Sales data from POS/ERP
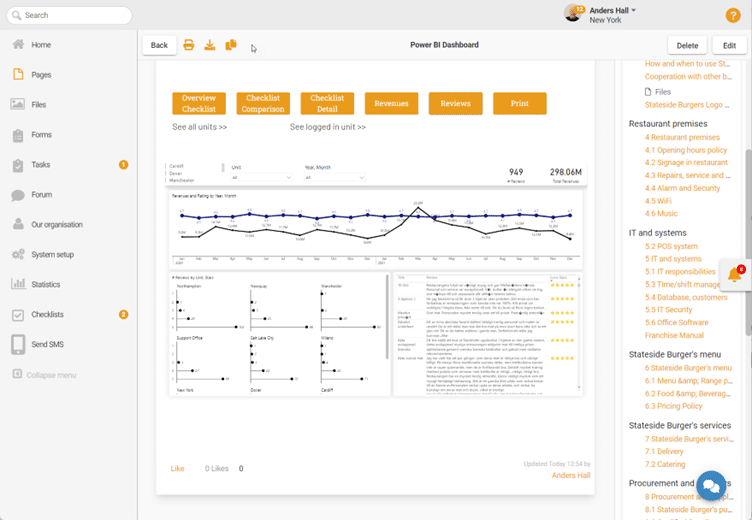
- Customer reviews from on-line sites like Tripadvisor, Google, Yelp etc
These metrics can give valuable insights to local operators and staff without any hurdles or overhead manual handling from HQ. Tables and graphs are interactive, so a click on a topic or bar chart will recalculate all in a split second.
Checklist overview – How are we doing with SOP compliance, Audits etc
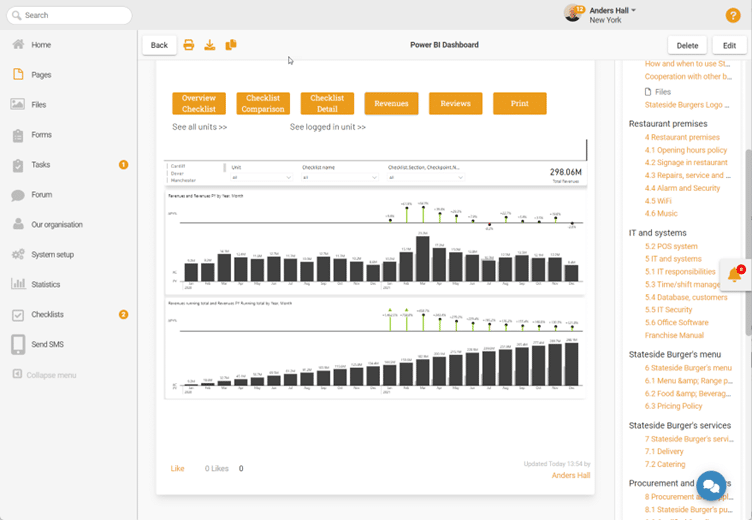
Sales data overview – How are we doing compared to budget, to last week, month etc
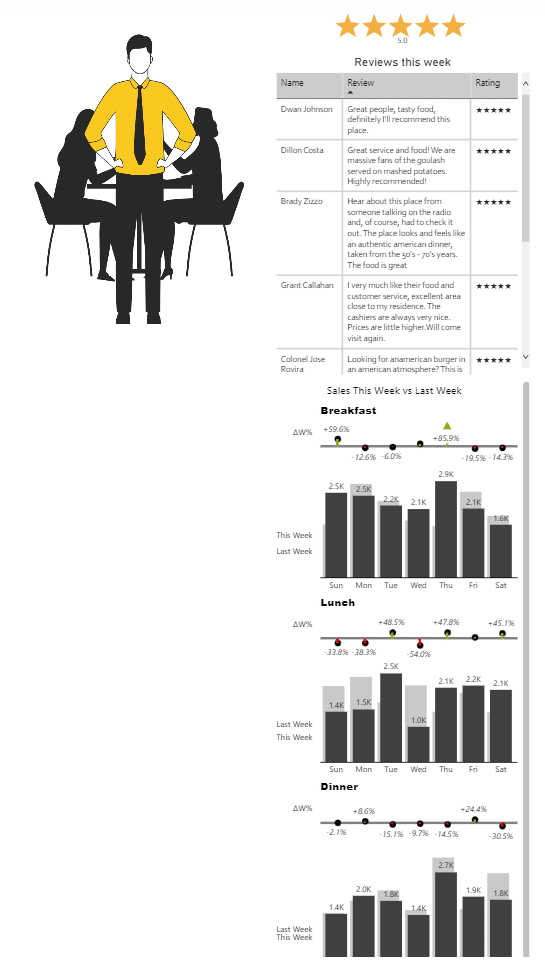
Revenue and Customer Reviews mixed to show how they relate. Including comments posted by customers online.
These dashboards are showing only relevant data according to each user and their profile in Chainformation. This allows for seamless access all the way from Group CEO to local intern; you only see what you need in relation to your job-description. Nothing more, nothing less.